My Chamber

Regional Data Center

For key Cape Cod statistics, visit DataCapeCod.com.

Access a Small Business Profile of Massachusetts small businesses.

Economic Impact 2024
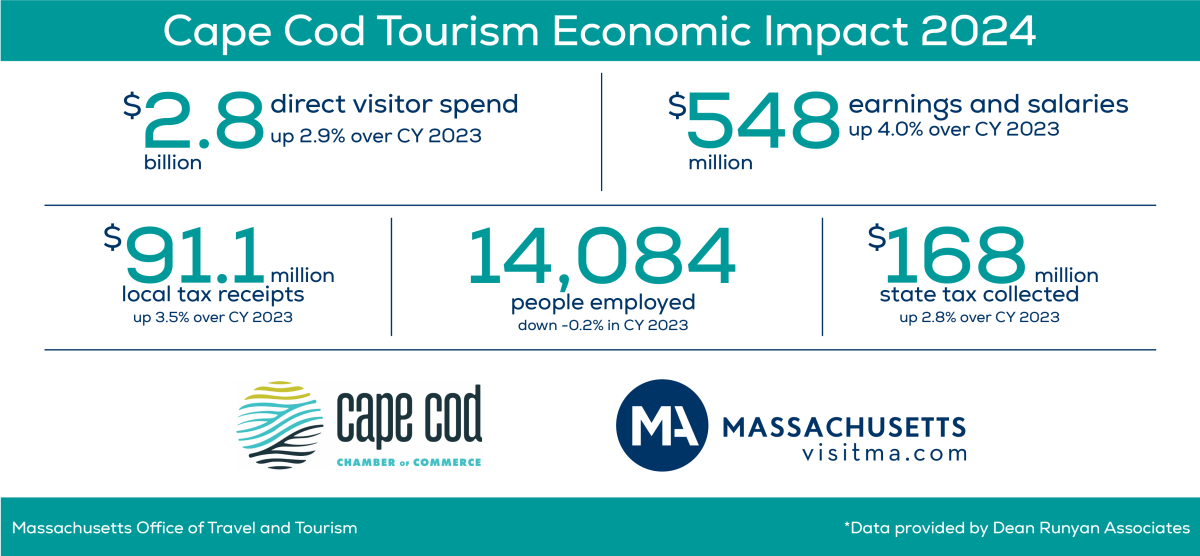
Source: Massachusetts Office of Travel & Tourism

Tourism Statistics

STR DATA
Barnstable County                      
 
2026  2025   2024     2023  2022   2021 2020 2019 2018
January                  
Occupancy   26.2% 30.3% 26.4% 35.4% 18.9% 23.9% 20.2% 28.8%
ADR   $120.53 $120.77 $127.43 $110.24 $127.66 $109.53 $114.02 $100.78
RevPAR   $31.64 $36.62 $33.67 $39.06 $24.19 $26.23 $22.98 $29.00
February                  
Occupancy   29.1% 33.7% 30.0% 42.1% 25.0% 32.5% 28.7% 35.1%
ADR   $131.30 $128.80 $132.90 $121.16 $148.30 $119.87 $102.82 $111.69
RevPAR   $38.19 $43.44 $39.92 $51.03 $37.01 $38.90 $36.16 $39.15
March                  
Occupancy   33% 38.6% 33.1% 42.4% 27.8% 19.2% 28.6% 44.6%
ADR   $128.27 $130.06 $134.59 $115.07 $136.14 $102.82 $120.05 $106.27
RevPAR   $42.30 $50.15 $44.55 $48.79 $37.88 $19.72 $34.32 $47.41
April                  
Occupancy   37.1% 41.6% 38.7% 46.6% 33.8% 12% 35.7% 46.4%
ADR   $154.33 $156.67 $153.12 $134.47 $168.42 $81.94 $134.62 $118.71
RevPAR   $57.24 $65.16 $59.23 $62.73 $56.99 $9.80 $48.03 $55.12
May                  
Occupancy   44.7% 42.9% 45.2% 52.1% 40.4% 12.1% 46% 52.9%
ADR   $197.30 $191.21 $183.52 $163.31 $206.66 $94.65 $170.08 $149.12
RevPAR   $88.18 $81.98 $83.02 $85.07 $83.40 $11.43 $78.18 $78.93
June                  
Occupancy   59.5% 60.9% 59.3% 63.7% 63.0% 25.3% 62.3% 68.3%
ADR   $261.46 $248.67 $245.64 $210.99 $285.55 $222.40 $231.16 $196.49
RevPAR   $155.64 $151.40 $145.77 $134.32 $180.03 $56.33 $143.92 $134.15
July                  
Occupancy   70.5% 69.2% 69.8% 72.8% 77.2% 56.5% 75.9% 77.1%
ADR   $357.61 $351.61 $340.06 $287.70 $387.32 $334.78 $322.81 $272.08
RevPAR   $252.14 $243.26 $237.37 $209.57 $299.20 $184.17 $244.93 $209.75
August                  
Occupancy   72.9% 71.2% 69.5% 72.8% 72.9% 66.9% 78.3% 80.0%
ADR   $370.91 $362.91 $340.59 $289.54 $391.05 $352.48 $333.82 $282.47
RevPAR   $270.47 $258.43 $236.76 $210.70 $285.22 $235.75 $261.30 $226.28
September                  
Occupancy   56% 57.7% 56.7% 65.2% 59.3% 47.8% 62% 69.3%
ADR   $229.32 $221.59 $234.27 $204.47 $266.20 $269.02 $207.61 $182.22
RevPAR   $128.39 $127.81 $132.75 $133.30 $157.90 $128.69 $128.66 $126.36
October                  
Occupancy   46.1% 45.6% 43.7% 56.2% 49.2% 31.2% 48.9% 57.3%
ADR   $193.57 $195.83 $184.15 $168.03 $203.42 $186.07 $159.93 $145.62
RevPAR   $89.16 $89.27 $80.50 $94.50 $100.16 $58.08 $77.96 $83.25
November                  
Occupancy   26.5% 29.5% 29% 31.7% 32.2% 26.3% 34.4% 38.4%
ADR   $154.98 $155.70 $149.74 $176.18 $164.57 $122.96 $133.87 $121.84
RevPAR   $41.03 $46.01 $43.43 $55.88 $52.93 $32.32 $45.84 $46.76
December                  
Occupancy     24.2% 29% 27.7% 29.4% 17.3% 26.3% 31.6%
ADR     $136.00 $136.04 $154.62 $152.14 $131.91 $136.88 $117.00
RevPAR     $32.95 $39.48 $42.84 $44.77 $22.81 $36.02 $36.99


CAPE COD NATIONAL SEASHORE VISITS 2025 2024    2023  2022   2021 2020 2019 2018
January 116,580 106,927 123,834 115,069 173,766 162,342 115,019 111,813
February 116,911 131,967 150,548 158,373 151,898 135,718 132,239 123,189
March 152,434 155,007 154,830 193,554 179,862 167,258 160,318 173,714
April 231,833 243,604 286,438 259,141 279,598 201,571 219,559 198,375
May 324,770 358,597 319,756 308,573 343,189 276,179 364,695 304,414
June 465,730 484,241 400,565 448,788 513,321 444,372 447,107 492,219
July 553,744 680,231 541,454 649,020 589,504 776,924 665,409 639,254
August 675,276 624,569 720,365 668,802 641,339 683,757 752,184 773,806
September 455,454 441,373 553,250 473,582 494,851 509,143 556,858 525,186
October 315,785 312,100 303,986 369,295 343,377 389,557 322.952 307,047
November 178,393 176,971 188,029 192,086 183,491 211,663 184,546 159,980
December 125,409 137,203 139,327 161,937 152,591 162,639 191,552 147,013
TOTAL: 3,712,319 3,675,819 3,837,952 3,998,220 4,037,007 4,121,125 4,122,438 3,956,010


BARNSTABLE MUNICIPAL
AIRPORT TRAFFIC
2025     2024    2023   2022 2021 2020  2019 2018
January 3,875 2,798 2,888 2,750  2,797 4,970  4,442 5,543
February 3,663 3,190 2,339 2,739 2,871 4,516 3,780 4,492
March 4,488 3,558 3,275 4,091 4,406 4,458 5,580 5,051
April 4,783 3,594 3,137 4,382 3,773 2,935 4,820 5,455
May 4,948 4,482 4,004 4,589 5,455 3,650 5,316 6,161
June 6,453 5,622 4,679 6,378 6,347 4,526 5,667 7,417
July   6,255 5,554 6,802 6,832 5,543 7,622 7,004
August   7,051 5,277 5,791 7,186 6,045 7,623 6,796
September   5,774 4,014 4,983 5,735 5,150 6,378 5,014
October   4,252 4,104 4,391 4,826 4,695 5,252 5,184
November   4,252 3,809 3,745 4,196 3,699 5,002 4,577
December   3,670 2,849 2,928 3,937 3,192 4,635 4,656
TOTAL:   54,498 45,929 53,569 58,361 53,379 66,117 67,350


SOCIAL MEDIA REACH As of November 2025
Facebook -  @VisitCapeCod (total #) 60.7k
Twitter - @VisitCapeCod (total #) 17.7k
@DougtheQuahog (Twitter & Facebook) 7.6k
Pinterest - @VisitCapeCod (total #) 1.7k
Instagram - @VisitCapeCod (total #) 61.4k
TikTok @VisitCapeCod 4.3k
YouTube @VisitCapeCod (total # of views in 2025) 16.7k views